Using history to forecast the future
UK feed wheat futures are influenced by the global wheat price and heavily aligned to Paris milling wheat futures. Paris milling wheat futures are again linked to the global export market and consequently the benchmark of Chicago wheat futures.
In terms of volume, Russia is more influential than the US, due to the relatively small uptake of Black Sea cash-settled wheat futures, Chicago wheat remains the best reflection of the global export market and is the most traded by speculative investors.
In 2020, due to downturn in the global economy, agriculture has again become a popular investment opportunity. With speculative involvement in agricultural commodities, it is worth revisiting a couple of the technical indicators that are used by speculative investors to assess market movement and opportunities.
Technical Indicators
Moving Averages
Perhaps the simplest of indicators is that of moving averages (MA) we publish these each day in our daily market report. Simply averaging the daily market close prices, provides an indication of how far today’s current market price sits above, or below the trend. Choosing different time scales, such as 10, 50 and 100-day moving averages, gives an indication of the rate at which markets are changing. In an upward moving market, the short-term average will move away from the longer-term averages. Understanding where these averages are allows sellers to sell above and buyers to buy below these levels and should be considered within a risk management strategy.
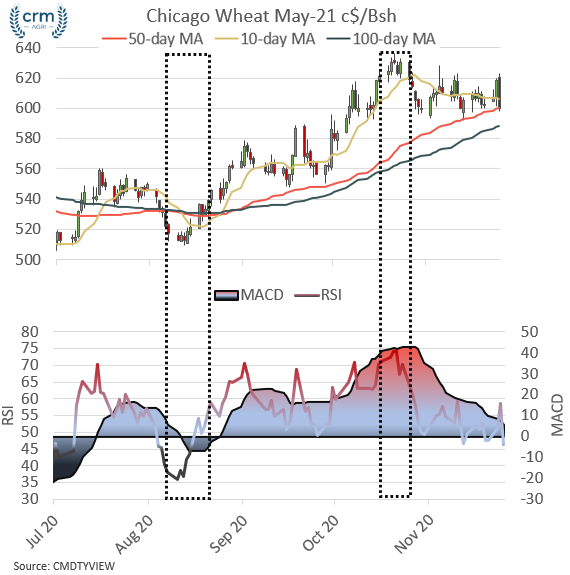
However, as markets consolidate, as has been the case in US Chicago markets during November, the longer-term moving averages ‘catch up’ – see the figure below.
From a trading perspective when the short-term average crosses the longer-term averages, this can be assessed to be a strong sell signal, alluding that markets have run out of momentum and are about to enter a phase of correction or consolidation. This crossing of short term and long-term averages could soon be seen on CBOT wheat.
MACD
Another technical indicator used by traders is that of MACD (Moving Average Convergence Divergence). Although sounding complex, MACD is a simple concept, building on Moving Averages. A MACD band is simply the difference between a short-term Moving Average and a longer-term Moving Average.
Like the crossing over of Moving Average lines, ‘points of inflection’ in MACD indications can be useful trading signals to assist decision making. A point of inflection of MACD bands is where short-term and long-term moving averages start to move closer to one another or indeed further away, resulting in a peak or trough.
An example of where short-term moving averages crossed over longer-term averages was during August as highlighted below, this also occurred with a MACD point of inflection. Combined this represented a strong buy signal, at what tuned out to be a market low.
The next clear example of a strong MACD signal occurred toward the end of October, where the short-term average moved toward the longer-term averages. Again, this proved to be a top to the market. Combined with an imminent crossing of Moving Averages, this sell signal could soon encourage further speculative selling.
RSI
The third commonly used indicator is RSI or Relative Strength Index. Used to assess the speed at which markets are changing, this can allude to markets having pushed higher and out of trend, or falling faster than is sustainable. Essentially providing an indication of momentum and market movement, RSI is calculated by using the average gain and average loss over a 14-day period.
Having values between 0 – 100, an RSI below 30 implies markets are falling at an unsustainable rate, where over 70 are considered overbought. Coinciding with a strong MACD signal in October, the RSI value crept above 70, creating a strong sell signal which again held true and proved to be the peak of the market.

Using a combination of indicators can help provide a clear justification for basing purchasing or selling decisions upon.
Technical analysis is not a silver bullet, we believe a combination of fundamental analysis combined with technical analysis, whilst considering the unique domestic market issues and those of each business trading grain should form the foundations of a well-balanced risk management strategy.
Get in touch for more information – research@crmagri.co.uk


